- はじめに -
端的にやりたい事を画像で説明すると以下

データ標本から確率密度関数を推定する。
一般的な方法としては、正規分布やガンマ分布などを使ったパラメトリックモデルを想定した手法と、後述するカーネル密度推定(Kernel density estimation: KDE)を代表としたノンパラメトリックな推定手法がある。
本記事ではKDEの理論に加え、Pythonで扱えるKDEのパッケージの調査、二次元データにおける可視化に着目した結果をまとめておく。
- カーネル密度推定(KDE)とは -
を未知の確率密度関数
を持つ独立同分布からの標本としたとき、任意のカーネル関数
、パラメータ
のカーネル密度推定量は以下の式で表される。
つまるところ、標本を使ったKernelを足し合わせて母集団の分布に寄せたいという話。
カーネル関数 は Gaussian Kernelが代表的。
Rectangular、Triangular、Epanechnikov等、以下性質を満たすものが使われる。
,
,
それぞれの特性については後述する
パラメータ はBandwidth、バンド幅等と呼ばれる平滑化のためのパラメータで、直感的に標本の幅やデータ数に合わせて調整する必要がある事がわかる。
経験的に調整する方法やcovariance(共分散推定)による調整方法等があり、後述する通りそれらが実装されているPythonパッケージもある。
式を見てわかるように、データ上でカーネル関数を足し合わせているだけなので計算が簡単で、分布に対する仮定も非常に少ない。
また、多変量、多次元への拡張やクロスバリデーションによる最適化も可能である。
Kernelの足し合わせでは、離散コサイン変換(DCT)、高速フーリエ変換(FFT)を利用した高速な計算方法が提案されており、一般的なパッケージではこれらが利用されている。
FFT-Based Fast Bandwidth Selector for Multivariate Kernel Density Estimation - arXiv [A Gramack, stat.CO, 2015]
FFTベースの手法以外では、N個の点のM個の評価(各入力/出力対間の距離計算)であると捉え、一般化N体問題としてkd木(kd tree)やball treeに落とし込んで解く手法がある。
sklearn等ではK近傍法 (K-nearest neighbor) の実装で使われているアルゴリズム。
Alexander G. Gray's N-Body Page
survey/kdtree.md at master · komi2/survey · GitHub
kd木のようなデータ構造を使うことで、データポイントを空間的に分離して計算し高速化出来る。
木にする事で各Kernelの相対的な誤差(relative tolerance: rtol)、絶対的な誤差(absolute tolerance: atol)
をパラメータとして設定する必要があるが、パラメータに応じた以下の精度で高速に近似カーネル密度推定値を計算することが可能である事が示されている。
Density Estimation Trees - CMU Statistics - Carnegie Mellon University
Forest Density Estimation - arXiv [H Liu, stat.ML, 2010]
KDEの欠点として、パラメトリックな手法に比べて次元が大きい場合に収束レートが非常に遅い、データ点が多い場合のメモリ量や計算量が大きい等があり、適切なパラメトリックモデルが得られてない場合に利用する手法である。
Wikiが割りと丁寧
カーネル密度推定 - Wikipedia
ネットで先生方の講義資料が沢山あるのでGoogleでも
データ解析 第十回 ノンパラメトリック密度推定法 鈴木大慈
カーネル密度推定法(第12章) - TOKYO TECH OCW 杉山 将
カーネル法入門 カーネル法によるノンパラメトリックなベイズ推論 福水健次 統計数理研究所/総合研究大学院大学
英語だと以下辺り参考
http://www.shogun-toolbox.org/static/notebook/current/KernelDensity.html
Kernel Density Estimation in Python | Pythonic Perambulations
GetDist: Kernel Density Estimation
[1704.03924] A Tutorial on Kernel Density Estimation and Recent Advances
- Python KDEパッケージの比較 -
調べて出てきたパッケージとKDEの実装クラスを以下に挙げる
- SciPy
- class: stats.gaussian_kde
- doc, tutorial
- Bandwidth: 2種類 ["scott", "silverman"] + 自前実装
- Kernel: gaussianのみ
- Scipyベースのやつら
- Pandas
- Matplotlib
- class: GaussianKDE
- doc
- 実装を見るにScipyの実装を少し改修したものを使っている
- seaborn
- class: kdeplot
- doc
- 実装見ると中身はPandasのplot.kde(つまりSciPy)
- sklearn
- class: neighbors.KernelDensity
- doc
- 独自実装 [ Github ]
- Tree algorithmで2種類 ["kd_tree"|"ball_tree"]
- 木なので距離関数metric、葉数leaf_size、前述のatolとrtolを調整する
- Metric: 11種類 [“euclidean", “manhattan", “chebyshev", “minkowski", “wminkowski", “seuclidean", “mahalanobis", “haversine", “hamming", “canberra", “braycurtis"] + 自前実装 [ doc ]
- Kernel: 6種類 ["gaussian", "tophat", "epanechnikov", "exponential", "linear", "cosine"]
- Bandwidth: 自前で用意する必要があるがGridSearchができる
- Statsmodels
- class: api.KDEUnivariate, api.KDEMultivariate
- doc, tutorial
- 独自実装 [ Github ]
- KDEUnivariateが一次元でFFTベースの高速実装
- KDEMultivariateが多次元でFFT効率悪いので分けられているがこちらはcross-validationが使える
- Bandwidth: 3種類 ["scott", "silverman", "normal_reference"]
- Kernel: 7種類 ["biweight", "cosine", "Epanechnikov", "Gaussian.", "triangular", "triweight", "uniform"] + 自前実装
- PyQt-Fit
- class: kde
- doc, tutorial
- Bandwidth or Covariance: 4種類 ["variance_bandwidth", "silverman_covariance", "scotts_covariance", "botev_bandwidth"] + 自前実装
- Kernel: 4種類["Gaussian", "Tricube", "Epanechnikov", "Higher Order"] + 自前実装
- Kernelの中のパラメータやデータポイントごとのbandwidth設定(lambdas)、データポイントごとの重み(weights)、methodではカーネルの足し合わせ方まで選べてわりと高級
- PyQtなるGUI実装のためのパッケージだが切り離されている
- 使えるところでDCTかFFTを使ってくれる
- AstroML
scipy, statsmodels, sklearn, pyqt-fitの4つが大体メイン。
実装されているアルゴリズムや方針はそれぞれ。
scipy以外は大体どれも自作のbwやKernelが使える。
入力で言うとsklearn以外はlistそのまま突っ込める。sklearnだけnp.array[:, None]。
以下利用するデータセット
後述のスクリプトではscikit-learnで取得できるirisのデータセットを利用する。
pip install numpy
pip install pandas
pip install scikit-learn
# -*- coding: utf-8 -*-
import numpy as np
import pandas as pd
from sklearn import datasets

# irisデータセットサンプル
iris = datasets.load_iris()
# pandas
data_pd = pd.DataFrame(data=iris["data"], columns=iris["feature_names"])
display(data_pd.head())
# 以降ではirisの"petal length (cm)"カラムを利用する
# list
data_list = [x[3] for x in iris["data"]]
# np.array
data_np = np.array(data_list)

# x軸をGridするためのデータも生成
x_grid = np.linspace(0, max(data_list), num=100)
# データを正規化したヒストグラムを表示する用
weights = np.ones_like(data_list)/float(len(data_list))

グラフ描画は基本的にmatplotlib
import matplotlib
import matplotlib.pyplot as plt
plt.style.use('ggplot')
pandas
多分一番使われているだろう最も簡単なやつ
中身はscipyでgaussian_kdeが動いている
plt.figure(figsize=(14,7))
data_pd["petal length (cm)"].plot(kind="hist", bins=30, alpha=0.5)
data_pd["petal length (cm)"].plot(kind="kde", secondary_y=True)
plt.show()
Matplotlib内のKDE, secondary_y=TrueでY軸正規化して重ねられるので便利

scipy
1.0.0のリリースおめでとうございます。
gaussian_kdeのみだが、default値でかなりよしなにやってくれる。
pip install scipy
最もシンプルに書くと以下
from scipy.stats import gaussian_kde

kde_model = gaussian_kde(data_list)
y = kde_model(x_grid)

plt.figure(figsize=(14,7))
plt.plot(x_grid, y)
plt.hist(data_list, alpha=0.3, bins=20, weights=weights)
plt.show()

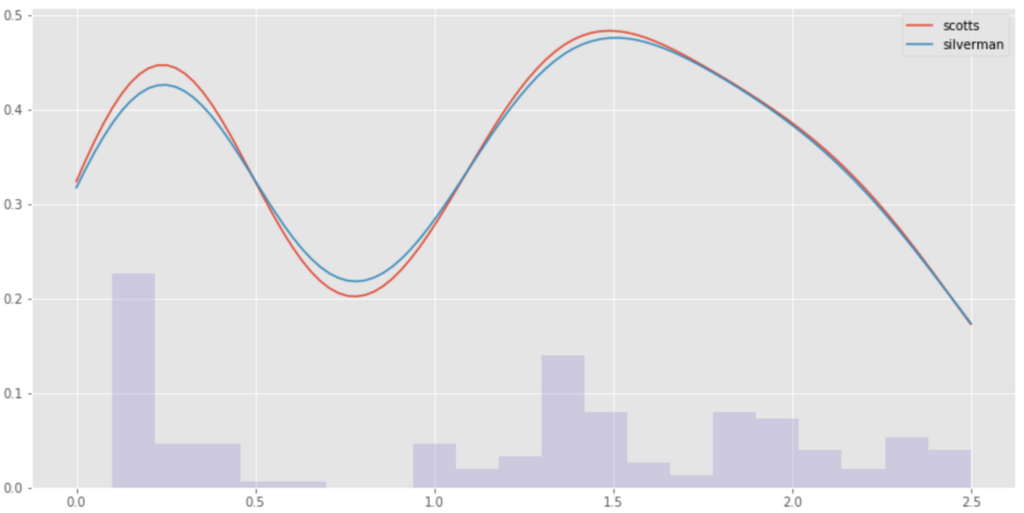
Bandwidthの推定はdefaultで以下scotts_factor
以下silverman_factorも選べるので比較してみる
scotts = gaussian_kde(data_list)
y_scotts = scotts(x_grid)
silverman = gaussian_kde(data_list, bw_method='silverman')
y_silverman = silverman(x_grid)

plt.figure(figsize=(14,7))
plt.plot(x_grid, y, label="scotts")
plt.plot(x_grid, y_silverman, label="silverman")
plt.hist(data_list, alpha=0.3, bins=20, weights=weights)
plt.legend()
plt.show()

自前の関数でもできる
def kde_bw(obj):
    return obj.n * 0.001

kde_model_origin = gaussian_kde(data_list, bw_method=kde_bw)

scikit-learn
他と違ってtree-baseな構造を使っていてかなり高速。
sklearnに親しみがある人が多いと思うし、記述も簡易。
基本的なKDE
# -*- coding: utf-8 -*-
from sklearn.neighbors import KernelDensity

# default
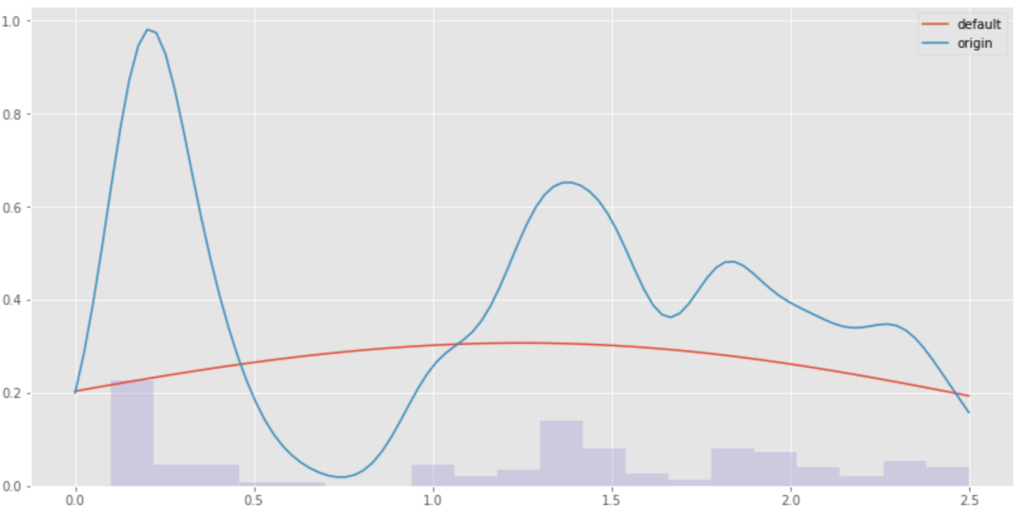
kde_model = KernelDensity(kernel='gaussian').fit(data_np[:, None])
score = kde_model.score_samples(x_grid[:, None])
# bw値を調整
bw = 0.1
kde_mode_bw = KernelDensity(bandwidth=bw, kernel='gaussian').fit(data_np[:, None])
score_bw = kde_mode_bw.score_samples(x_grid[:, None])

# マイナスが出るので指数関数かます
plt.figure(figsize=(14,7))
plt.plot(x_grid, np.exp(score), label="default")
plt.plot(x_grid, np.exp(score_bw), label="origin")
plt.hist(data_list, alpha=0.3, bins=20, weights=weights)
plt.legend()
plt.show()

出力からわかるようにBW値の設定は必須である。
Using Kernel
sklearnで使えるKernelを全て見てみる。
それぞれのKernelの数式は以下にまとまっている。
2.8. Density Estimation — scikit-learn 0.21.3 documentation
# Kearnels
plt.figure(figsize=(14, 7))
plt.grid(color='white', linestyle='-', linewidth=2)
X_src = np.zeros((1, 1))
x_grid = np.linspace(-3, 3, 1000)
for kernel in ['gaussian', 'tophat', 'epanechnikov',
               'exponential', 'linear', 'cosine']:
    log_dens = KernelDensity(kernel=kernel).fit(X_src).score_samples(x_grid[:, None])
    plt.plot(x_grid, np.exp(log_dens), label=kernel)
plt.legend()
plt.show()

理論通りの結果が見られる。
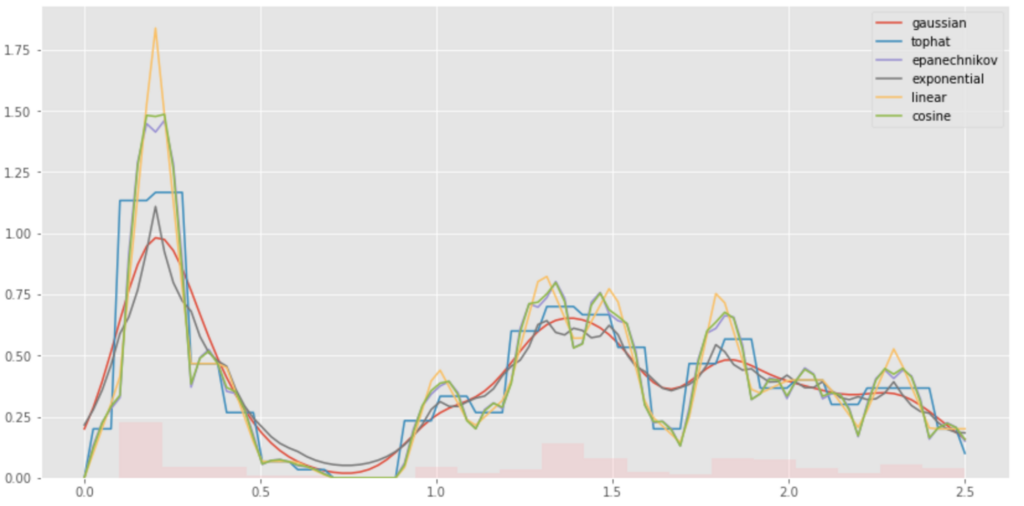
これらを使いKDE値を計算してplotしてみると以下。
# plot
plt.figure(figsize=(14,7))
for kernel in ['gaussian', 'tophat', 'epanechnikov',
               'exponential', 'linear', 'cosine']:
    kde_modes = KernelDensity(bandwidth=bw, kernel=kernel).fit(data_np[:, None])
    scores = kde_modes.score_samples(x_grid[:, None])
    plt.plot(x_grid, np.exp(scores), label=kernel)
plt.hist(data_list, alpha=0.3, bins=20, weights=weights)
plt.legend()
plt.show()

それぞれのKernelの形を足し合わせて元の分布を表現していることがよくわかる。
GridSearch
上記のようなパラメータをGridSearchでクロスバリデーションできる。
ここはsklearnらしさある。
from sklearn.model_selection import StratifiedKFold

grid = GridSearchCV(KernelDensity(),
                    {'bandwidth': np.linspace(0.1, 1.0, 10)},
                    cv=20)
grid.fit(data_np[:, None])
print(grid.best_params_)

kde_model_best = grid.best_estimator_
best_score = kde_model_best.score_samples(x_grid[:, None])

plt.figure(figsize=(14,7))
plt.plot(x_grid, np.exp(best_score), label='bw=%.2f' % kde_model_best.bandwidth)
plt.hist(data_list, alpha=0.3, bins=20, weights=weights)
plt.legend()
plt.show()

GridSearchといえば大変なイメージが強いが、KDE自体が高速なので割りと速くできる。
標本がバラけるような環境で困ったらこれ。
statsmodels
pip install statsmodels
見るのはKDEUnivariate。
データはfloat値である必要がある。
sampleがnotebookなのでそちらも参考に[ kernel_density ]
import statsmodels.api as sm

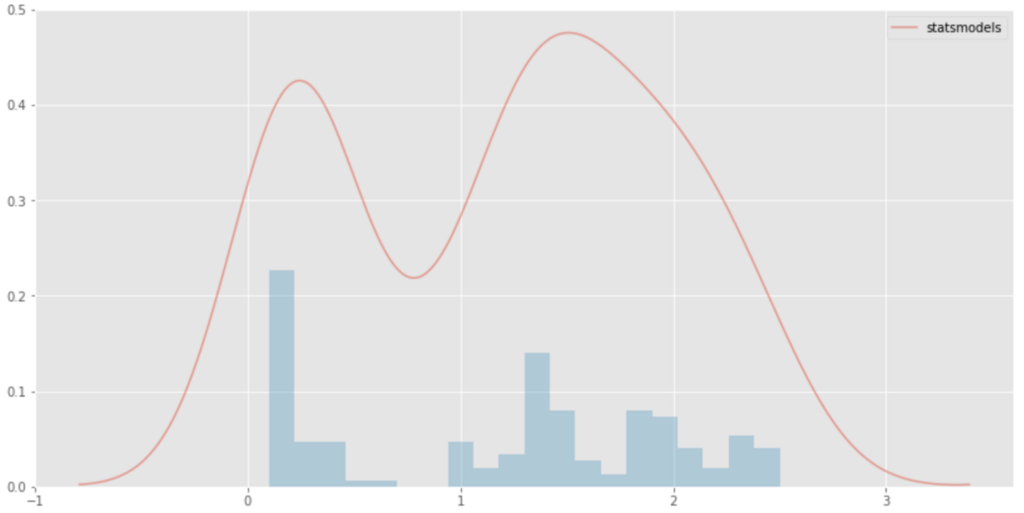
kde_model = sm.nonparametric.KDEUnivariate(data_list)
kde_model.fit()

plt.figure(figsize=(14,7))
plt.plot(kde_model.support, kde_model.density, alpha=0.5, label="statsmodels")
plt.hist(data_list, alpha=0.3, bins=20, weights=weights)
plt.legend()
plt.show()

中身がFFTなだけあってシンプルなデータだとかなり早い。
pyqt-fit
インストールでこける
pip install pyqt-fit
Python3.6だと以下ERROR
    register_loader_type(importlib_bootstrap.SourceFileLoader, DefaultProvider)
AttributeError: module 'importlib._bootstrap' has no attribute 'SourceFileLoader'
pyenvでPython3.5.xにしたら上記ERRORは消える
それでも以下のようにpath.pyのバージョンでERRORになる
cannot import name 'path'
以下参考にpath.pyのバージョン指定してインストールしてnotebookとかPython周り再起動
python - PyQt_Fit: cannot import name path - Stack Overflow
sudo pip install -I path.py==7.7.1
インストールできてもimportでエラー
# from matplotlib.backends import _macosx
# RuntimeError: Python is not installed as a framework. The Mac OS X backend will not be able to function correctly if Python is not installed as a framework.
# See the Python documentation for more information on installing Python as a framework on Mac OS X.
# Please either reinstall Python as a framework, or try one of the other backends.
# If you are using (Ana)Conda please install python.app and replace the use of 'python' with 'pythonw'.
# See 'Working with Matplotlib on OSX' in the Matplotlib FAQ for more information.
これはmatplotlib.pylotのsavefig()の「RuntimeError: Invalid DISPLAY variable」と同じ原因なので、以下のようにmatplotlibのpyplotを読み込む前にbackendをAggに変えて回避する。
import matplotlib
matplotlib.use('Agg')
import matplotlib.pyplot as plt
Cythonが入ってないと以下Warningが出る
# Warning, cannot import Cython kernel functions, pure python functions will be used instead
KDEでは不要だが、使いたければpipで入れれば消える。
pip install cython
Kernelは4種類で内部パラメータもイジれる
bandwidthかcovarianceも["variance_bandwidth", "silverman_covariance", "scotts_covariance", "botev_bandwidth"]がある。
データポイントごとのbandwidthや重みも扱え、Kernelの足し合わせ方も選択できる。
from pyqt_fit import kde, kde_methods

kde_model1 = kde.KDE1D(data_list, bandwidth=0.1)
kde_model2 = kde.KDE1D(
    data_list,
    method=kde_methods.reflection,
    covariance=kde.variance_bandwidth(0.1, data_list))

plt.figure(figsize=(14,7))
plt.plot(x_grid, kde_model1(x_grid), label='bw={:.3g}'.format(kde_model.bandwidth))
plt.plot(x_grid, kde_model2(x_grid), label='variance bw={:.3g}'.format(kde_model.bandwidth))
plt.hist(data_list, alpha=0.3, bins=20, weights=weights)
plt.legend()
plt.show()

裏で勝手にFFT使ってくれるのでかなり早い。
- 速度比較 -
以下で適当にn個作ったデータでKDE計算速度を比較する。
np.random.normalって中身ガウス分布じゃんパラメトリックでやれよ…という話ではあるが、その他の条件で平等な評価が気軽ではないため利用する。
x_t = 50 * np.random.rand() * np.random.normal(0, 10, n)
x_g = np.linspace(min(x_t), max(x_t), 100)
環境はPython 3.5 (3.6ではpyfitがうまくインストールできないため)
Macbook Pro 2.8GHz Core i7, memory 16G
nはデータ数
それぞれdefaultのパラメータで、100回KDE算出した際の平均速度(秒)を計算した。
ついでなのでsklearnのGridSearch(BW値のCross-validation)も追加で行う。
| package | n=100 | 1000 | 10000 | 100000 | 1000000 |
|---|---|---|---|---|---|
| scipy | 0.001563 | 0.003090 | 0.014148 | 0.142844 | 1.876725 |
| statsmodels | 0.000650 | 0.000775 | 0.002706 | 0.022177 | 0.297552 |
| scikit-learn | 0.000477 | 0.001233 | 0.017090 | 0.338675 | 11.294480 |
| pyfit | 0.000410 | 0.001728 | 0.016702 | 0.236698 | 2.491684 |
| sklearn(gridsearch) | 0.161637 | 0.285323 | 15.952579 | None | None |
gridsearchは計算時間からこれ以上は無理そうなので断念。
シンプルな一次元データという事もあるが、statsmodelsクソ早い。
sklearnはtree-baseで最初早いけど、データ数の増加に弱い。理論通りの結果という感じ。
- おわりに -
速度ならstatsmodels、メソッドやパラメータの種類ならpyfit、GridSearchや他クラスの利用やclass拡張ならsklearn、scipyは簡易な利用がメリットだということが分かった。
KDEについてこんなに詳しく調べるつもりはなかったけど、冒頭に出したk-nearest neighborのkd木の実装の論文を読んでると面白くなったので土日を使ってしまった。
次はkd木な構造に関する記事を書く。
英語Wikiは丁寧なのでこちらもオススメ。
k-d tree - Wikipedia

- 作者: 黒木学
- 出版社/メーカー: 共立出版
- 発売日: 2017/08/24
- メディア: 単行本
- この商品を含むブログを見る